Transit: What
is happening elsewhere?
Normally if you are going to invest
in a new business, you want to know how that type of business is faring in
other communities. Strangely, we fail to do that for
rail transit proposals.
Yes, our elected officials go to other cities and kick the
tires, so to speak. However, they do not then undertake the laborious examination of operating and financial
results that a proper investment decision requires.
Texas Transportation
Institute, which monitors the
nation’s traffic congestion, has said that,
“To accomplish a goal of
maintaining a constant congestion level in these areas by only adding transit
riders [would require] expanding transit systems by more
than one-third of the current ridership each year.”[i]
That’s a 250 percent increase
every three years and clearly, this is not happening here,[ii] the mainland,[iii] or Europe.[iv] Everywhere the
percentage of commuters using public transportation
is in decline.
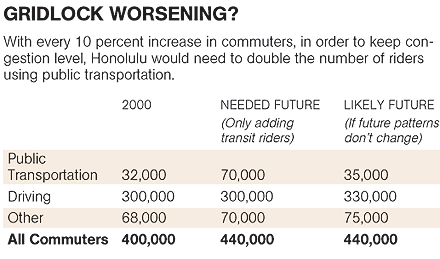
Here’s what they are talking about.
Honolulu
has 400,000 commuters and, of these, 8 percent, or
32,000, use public transportation. If
we do not increase this percentage, it means that for
each 10 percent increase in commuters, or
40,000, we will have 3,200 new commuters using public transportation and the rest, some 36,800, using other
means, with the vast majority of
them driving alone. That means increased congestion.
On the other hand, if we set ourselves the goal of keeping level
the number of those commuting by automobile, then we have to double the
percentage of people public transportation
for each 10 percent growth in
commuters. This would keep traffic congestion at the same level it is today.
What is the likelihood of that happening?
If you examine the U.S. Department of Transportation’s analysis of America’s commuting habits, you find
that between 1980 and 2000, no metropolitan area with rail succeeded in
increasing the percentage of commuters using public transportation. One area, San Diego, held level but all others
experienced declines.[v]
This is why from 1990 to 2000, despite federal, state and
local operating subsidies[vi]
and capital outlays[vii] for public transportation
totaling over $200 billion, it lost ground. The national increase in commuters
driving to work was 13 million;
those commuters using public transportation
declined.[viii] It is also why
all rail areas saw significant increases in traffic congestion.
Are there any answers?
Given the reality that we are not getting out of our cars — no
matter what — and given our inability to fund expansion of our regular highway
system sufficiently, then we have to turn to some form
of congestion pricing. This is the only tool that will allow us to manage a
highway for the maximum throughput
of vehicles. It should not be surprising since the variable pricing of resources
for which there is too much demand is
how we manage everything from housing to clothing to food.
Honolulu’s best initial move could be High Occupancy Toll
lanes, or HOT lanes, between Waikele
and Iwilei in the form of an elevated
reversible two lane highway on which buses and vanpools would have priority and automobiles pay a toll.[ix]
If anyone knows of any other method that has reduced traffic
congestion in practice (and just not in theory),
please let me know.
Cliff Slater is a
regular columnist whose footnoted columns are at: www.lava.net/cslater
[iv]
Christian Gerondeau. “Mass
Transit: A Tale of Two Cities' Transportation” Atlanta Journal Constitution. November 1,
2000.“Christian Gerondeau is the author
of the Paris Area Railway Master Plan, was a transportation
adviser to the French government in the 1970s and wrote the 1997 book
"Transport in Europe."
The Journal invited Gerondeau to comment on his experience with mass transit in
light of Atlanta's
newly adopted transportation plan
that heavily focuses on rail.”
|
2000
|
|
Needed Future
|
%
|
Likely future
|
%
|
Public Transportation
|
32,000
|
8%
|
70,000
|
16%
|
35,000
|
8%
|
Driving
|
300,000
|
75%
|
300,000
|
68%
|
330,000
|
75%
|
Other
|
68,000
|
17%
|
70,000
|
16%
|
75,000
|
17%
|
All Commuters
|
400,000
|
100%
|
440,000
|
100%
|
440,000
|
100%
|
|