Honolulu Advertiser
SECOND OPINION by Cliff Slater
March 22, 2004
A proper BRT proposal
A recent column (“Transit alternatives abound,” 12/29) discussed briefly a proposal for a transitway as being preferable to a rail transit line. This column attempts to answer the many questions that readers asked about it.
A transitway or busway is an evolving concept the latest version of which is HO/T lanes, or High Occupancy/Toll. These are highway lane(s) with priority for buses and other very high occupancy vehicles such as vanpools, which go free, with any excess capacity opened to automobiles paying an electronic toll.
The two-lane, reversible, HOT transitway would be elevated on pedestals between the first on-ramp at the H-1/H-2 merge near Waikele and the last off-ramp at Pier 16, near Hilo Hattie. Traffic on it would flow one-way into town in the morning and reverse at noon time to run in the Ewa direction in the afternoon.
Tolls help reduce the total cost, which as defined here would be approximately $1 billion. Capitalizing the projected toll income would raise $200 million in a separate bond issue leaving $800 million to be financed federally and locally. State transportation officials have estimated that a rail line from Kapolei to Iwilei would cost $2.7 billion. [1] Moreover, note that rail transit lines incur significant operating costs; highways do not.
Either an elevated rail transit line or an elevated transitway would provide a high capacity transit spine along the Leeward Corridor. However, to understand why the transitway would be far preferable, one must understand some commuting facts, and some of the seemingly immutable laws of public transportation use, which are:
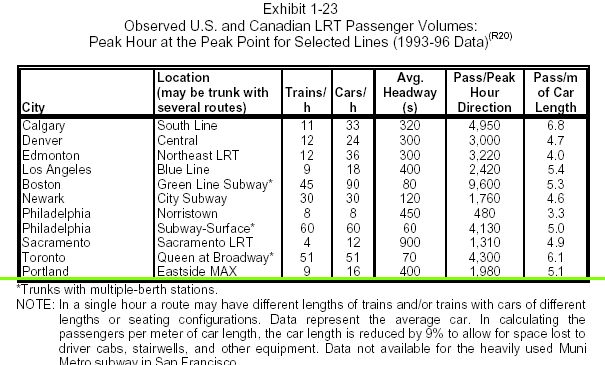
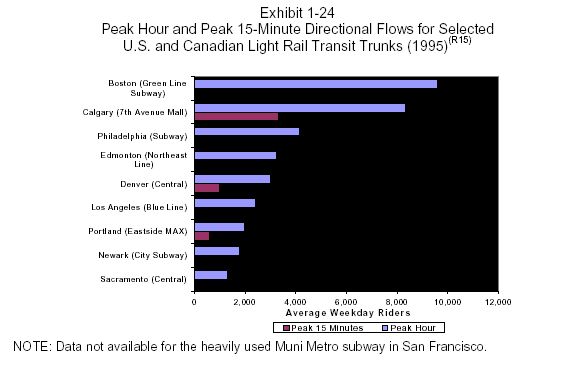
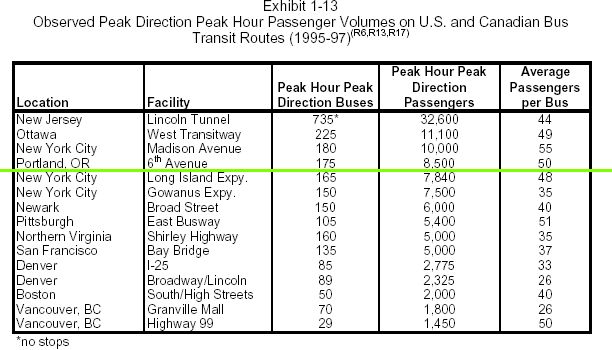
- A single lane of transitway dedicated to buses carries, in practice, twice as many passengers as most rail lines in the U.S. and some come close to New York City’s busiest line, the 8 th Avenue, which carries 43,000 passengers per hour in the peak direction. New Jersey’s Route 495 single lane transitway carries 30,000 passengers per hour whereas the largest rail volume outside New York City is Boston’s Red Line with only 13,000 per hour. Washington, DC’s I-395 transitway carries 21,800 per hour versus the Chicago N-S rail line’s 11,400. [2] All of these compare favorably to street railways, such as Portland’s, which carries just 1,980 per hour. [3]
- The greatest inducement to use public transportation is when riders can go door-to-door; commuters do not like to transfer, and so it deters their use of public transportation. [4]
- Since rail transit lines do not integrate well with roads and highways, it virtually assures that the great majority of rail commuters have to transfer. On the other hand, buses on transitways continue on to regular roads and highways and that allows more flexible routing.
- The average speed of the rail line currently being proposed for Honolulu will likely be around 23 mph, which is the upper speed limit for elevated and subway rail systems with stops every half-mile; distance between stops being the major determinant of average speed. [5]
The advantages of a transitway over rail transit are speed and continuity of travel. For example, imagine that a new reversible transitway is open and we are going to take a bus to work in town from beyond the H1/H2 merge. From the closest stop, the bus picks us up, takes us by local roads to the transitway, and then, at 50 mph, moves us steadily into town until we exit at the Pier 16 off-ramp onto Nimitz Highway. From there it will be a short, if slow, drive to Bishop Street to our workplace. [6]
On the other hand, imagine that the rail line opens along the same alignment as that planned in 1992. You walk to your local bus stop, take the bus to the nearest rail station, board the train, then travel at 23 mph into town to the nearest stop with the likelihood that it will be further away from one’s ultimate destination than would be possible by bus.
Higher speeds, together with the ability of the bus to reach closer to commuters workplaces and homes —and thus make transfers less likely — offer commuters the overall time reduction that can allow buses to successfully compete with the automobile, which must stay in the freeways — albeit now somewhat less congested.
Cliff Slater is a regular columnist whose footnoted columns are at www.lava.net/cslater
Footnotes:
[2] These data are from Charles A. Fuhs. High Occupancy Vehicle Facilities . Parsons, Brinckerhoff, Quade & Douglas. December 1990. p. 3-9-3. On the same page, Fuhs concludes that, “(This) comparison of person moving capacities for various U.S. rail and HOV projects...appears to cut through the myth that HOV facilities [e.g. transitways] do not have the person carrying equivalent of rail lines. Both modes can serve the person carrying capacity needs of about any corridor in North America."
U.S. Secretary of Transportation: "A number of busways, bus priority lanes and contraflow bus lanes have attracted and carry tremendous amounts of traffic. The Shirley Highway busway carries more people into and out of the Washington region's urban core during rush hours than any of the several rapid rail lines that serve Washington. The Express Bus Lane into New York carries more people across the Hudson during rush hours than any other single facility, despite the fact that it is only one lane.
All these busways carry more people per lane than a conventional expressway traffic lane. Busways can avoid the tremendous expense of widening urban freeways. In some cases, where widening is impractical, converting lanes to busways can increase overall carrying capacity.
Busways also reduce transit operating
cost.
They make van
and carpools more
attractive.
Pool vehicles
require no public operating funds and can
reduce peak bus
requirements.
Direct bus
operating costs are reduced by increasing
operating speeds and reducing maintenance
cost for brakes and other components that
suffer less wear and tear on busways than
in congested mixed traffic.
Busways also
encourage competitive provision of transit
services since different bus operators may
use the same busway."
The Status of the Nation's Local Mass
Transportation; Performance and
Condition.
Dept. of
Transportation - UMTA. 1988.
"At peak
times in the morning and afternoon, each
HOV lane [of the Shirley Highway] carries
7,000 people per hour...The much shorter
travel times and smoother traffic flow in
the HOV lanes attract additional commuters
to carpools, vanpools, and
buses.
As a result,
the Shirley Highway HOV lanes carry more
people into and out of the Washington
region's urban core during rush hours than
any of the...rail lines that serve
Washington."
Moving America: New Directions, New
Opportunities.
A Statement
of National Transportation
Policy.
U.S. Dept. of
Transportation.
February
1990.
[3]
The following from
Fuh, Charles A. HOV
Facilities Manual. Parsons,
Brinckerhoff. December 1990. 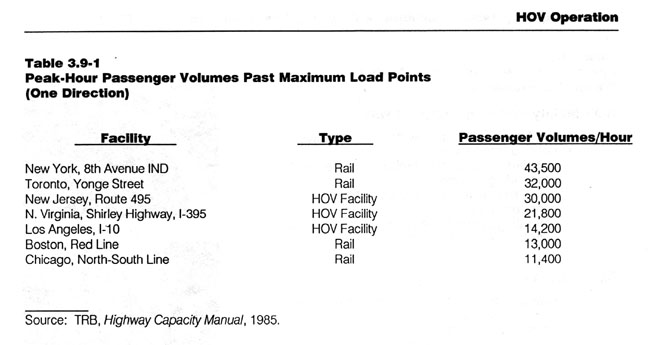
See also FTA's HOV facilities table.
[4] "Commuters choose among available transport modes mostly on the basis of comparative money costs and time costs of the total commute trip, door-to-door. Other attributes, such as comfort and privacy, are trivial as compared with
expenditures
of dollars and minutes.
Commuters
charge up the time spent in waiting for
and getting into a vehicle at several
times the rate they apply to travel inside
a moving vehicle.
This means
that the closer a vehicle comes to both a
commuter's house and workplace, the more
likely he is to use that vehicle rather
than some other.
It also means
that the fewer the number of transfers
between vehicles, the better"
Professor Melvin Webber,
Director, Institute
of Urban and Regional
Development,
UC
Berkeley.
Address to the Governor's Conference on
Videotex, Transportation and Energy
Conservation.
Hawaii State
Dept. of Planning and Economic
Development.
July
1984.
[5] Characteristics of Urban Transportation Systems- Chapter 2. FTA library, page 1-15. See also, Pushkarev, Boris S. and Jeffrey M. Zupan. Public Transportation & Land Use Policy. Indiana University Press. 1977. Exhibit 4.2.
[6] Principles that argue for the incremental addition of smaller buses are:
The larger the bus, and the number of riders per bus, the longer the time is spent stopping at every stop and loading and unloading. The advantage of a large bus (when full) over smaller buses is a lower cost per passenger.
However, the
smaller the bus, normally the greater the
acceleration and deceleration and the
fewer stops that have to be made together
with faster loading and unloading of
passengers. The disadvantage of the
smaller bus is a greater cost per
passenger.
While
generally speaking, small buses are more
costly per passenger the Atlantic City
jitney bus has some operating
characeristics that may upset that
equation. For example,
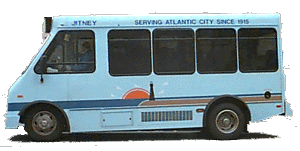 the operators of Atlantic City’s 190
buses keep them at home in their driveway,
have the vehicles serviced at regular
repair shops and have them washed at car
washes, or do it themselves. Thus, other
than modest dues to their Association,
they have no overhead. Most telling, is
that the $1.25 fare, with discounts for
students and seniors, is sufficiently
profitable for operators to be willing to
pay $160,000 for a medallion, in addition
to the cost of the air-conditioned
bus.
On the other hand, a transit bus is virtually a custom vehicle with all the high costs that that entails including repairs and maintenance and custom washing facilities. And while they have a longer life than a the smaller buses the initial cost per seat is far higher.
Many people are willing to pay more than regular fare for a guaranteed seat and a door-to-door trip, especially if it is faster. For example, vanpool total fares are approximately $85 per month (depending on location) whereas a bus pass has been, until recently, $27 a month. It was subsequently increased to $40 a month and vanpools saw a 30 percent increase in riders. Note that, "The nearly 500 vanpools on the I-395 [Shirley Highway] HOV lanes -- about 10% of the commuters in the corridor -- represents the best market penetration of vanpools in the nation . In addition, approximately 18% of all central business district (CBD) bound work trips from Prince William County, which is served by both the I-95 and I-66 HOV lanes, utilize vanpools." (Lew W. Pratsch, President, Virginia Vanpool Association. 4th National HOV Facilities Conference. TRB Transportation Research Circular #366 . December 1990.)
For these reasons, smaller vehicles even though more expensive, may offer customers true door-to-door commuting. In addition, they may offer a guaranteed seat and, if commuters they have gone grocery shopping in town, they may take it with them.